Developing a Collective Interrogation of Data on the South
Aug 31, 2023

The United States has a long history of race-based and economic inequity, particularly in the South. The Civil War, Reconstruction, and the Civil Rights Movement produced some progress toward a more equitable society. However, the recent pandemic, along with protests against police brutality, and extreme economic distress have revealed the depth of systemic racism and falsehoods in history. Yet, region-specific information is needed to understand how these challenges manifest in key policy areas in the South.
While there is a wealth of quantitative data available, less is known about the lived experience of those in the region to understand the history and current context of the data. Incorporating the voice of a diverse audience that includes academic, policy, practitioner, and community perspectives can help elucidate the complex realities of the region and inform policy and community action, to address systemic racism and inequity, and make the South a place where all people thrive.
In Fall 2022, MDC launched the State of the South convening series as a platform for exploring how Southerners are reckoning with contemporary economic, social, and environmental challenges. The series examines these issues with the awareness that equity cannot be assumed, but must be designed. The first and second convenings were in Durham, NC, and Berea, KY, and invited policymakers, academics, nonprofit leaders, artists, and community members to discuss policy and pathways to create equity in the South.
Duke’s Social Science Research Institute (SSRI) partnered with MDC on this initiative, with a specific focus on developing – and critically interrogating – quantitative data pertaining to the state of the South. This was considered the “Snapshots on the South” component of this initiative and was intended to address the following questions: How do individuals respond to quantitative data about the key social issues in the South? In particular, how do they respond with a critical lens and based on lived experience? Based on this response, what is needed for societal advancement or to provide a more comprehensive and holistic understanding of the world around us?
Understanding the “Snapshots on the South” process
The “Snapshots on the South” process began with the development of quantitative data profiles that addressed distinct topics in each convening/region of focus, based on MDC’s communication of local partners’ interests. In Durham, data profiles addressed aspects of economic disparity, demographics and demographic change, housing and gentrification, political affiliation and participation, and reckoning with history (e.g., removal of confederate monuments, CRT legislation); in Berea, they focused on economic disparity, family economic security, incarceration, and disaster recovery. Data visualizations were created, depicting economic, social, and political trends across Southern states, and focused on North Carolina or Central Appalachia. These visualizations were created using publicly available data, in many cases from the U.S. Census Bureau or other governmental sources.
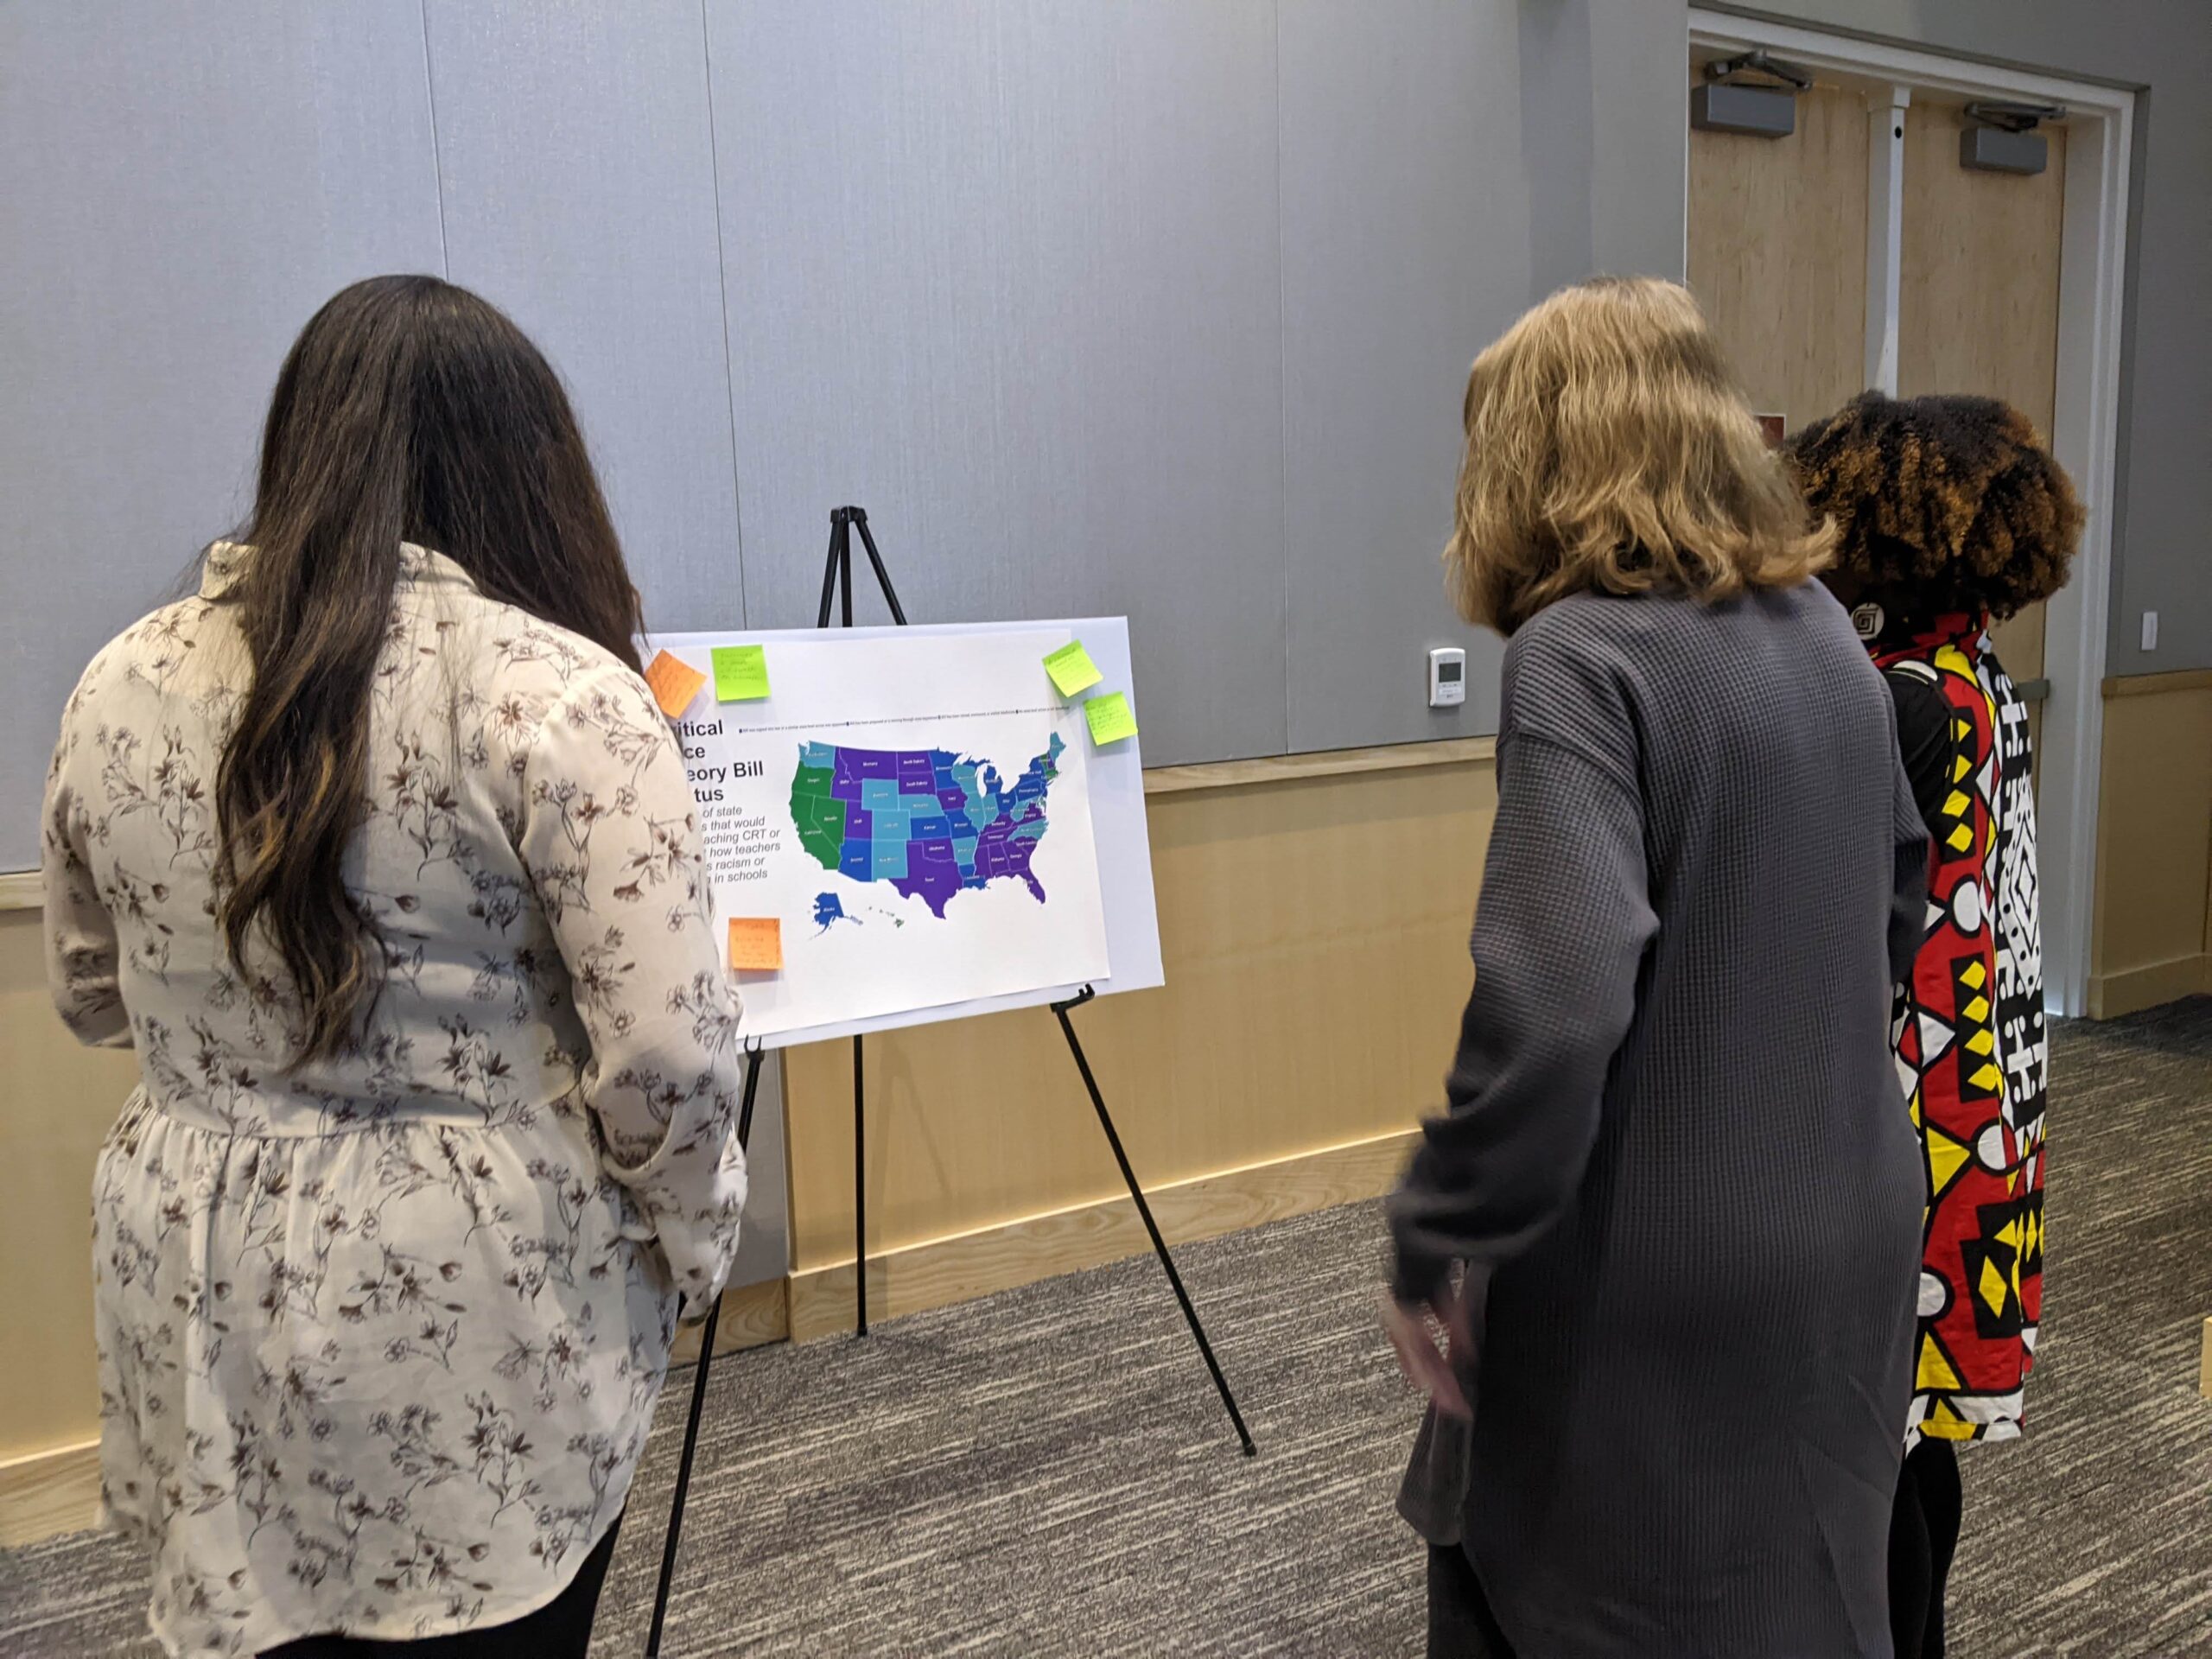
These data visualizations were presented to participants in the form of a “data walk,” where visualizations were placed on posters around a room and participants were asked to respond to them. In the first phase, participants walked around the room and, with post-it notes, provided comments directly on the data visualizations. They were asked to indicate where data shown a) resonated with their lived experience, and why; b) did not resonate with their lived experience, and why; and c) where it surprised them. This was considered the “data visualization response.” In the second phase, participants gathered in small groups to discuss their reflections as well as broader questions, including how history may have affected present realities, suggestions for social or policy, and critical thoughts or questions about the construction and use of data itself. Finally, participants were asked to individually reflect on and share, via an online form, three key takeaways from their discussion. This was considered the “key takeaway response.”
Across these two convenings, this process resulted in 199 data visualization responses and 144 key takeaway responses. The SSRI team analyzed participants’ responses from post-it notes comments and key takeaways using a qualitative coding software (Nvivo). They examined results to determine the specific focus and content of community interpretation and response, with specific attention to dominant themes.
Key learnings from the process: Desire for more information and attention to the importance of context
Participant responses showed a clear focus on questions, needs, surprises, or wonderings; this was more prevalent than a focus on alignment with personal experience or policy recommendations. In data visualization responses in Durham, across nearly all topics, responses most often reflected surprises or questions related to the root causes of the data they were seeing and the differences between Southern states. For example, many were curious about what factors enabled confederate monument removal in some states but not in others: “What has driven the progress in NC, TX, VA, and FL?” Similarly, many asked about differences in voter registration and turnout among southern states: “The decline in NC make[s] sense given gerrymandering, ID, etc. What’s driving increase or decrease in other states?” In fewer cases, respondents connected to prior personal experience or suggested policy changes; where this emerged, it was most often connected to topics related to housing. In Durham data visualization responses, housing was the only topic where various responses reflect alignment with one’s experience rather than surprise.
Berea data visualization responses most often reflected surprises or reflections of personal experience; however, most of these responses also included questions. For example, a question in response to the incarceration related visualization was, “How much is pre-trial incarceration?” Other questions that emerged reflected additional wonderings about the data. For example, a response to incarceration visualizations asked, “What is the underlying belief, history, etc. that drive the U.S. to be higher than other Western countries?” Questions also emerged that reflected the desire for additional data. For example, a response to the visualization on childcare arrangements and costs was, “Am curious how this compares to cost of living.” In another example, a response related to health professional shortage asks, “What does this look like when considering racial disparities?”
Through these responses, participants clearly highlighted gaps and needs in the data itself, including interest in or call for the availability of more comprehensive or nuanced data. As respondents were encouraged to think and speak critically to the data itself, these responses reflect one of the core potential outcomes envisaged from this data walk process. In Durham, key take-away responses, a majority of the data related responses focused on the limitations and gaps in the data. In Durham, direct responses to data visualization generally reflected clarifications desired or additional interests; in one-third of these responses, attendees requested to see other variables such as gender, age, race, and educational status. In Berea, similarly, many focused on the limitations in the data, though the Berea participants tended to focus on the need for greater context and explanation of the data for data-walk participants. One Berea respondent spoke to the view of data as deficit-focused, speaking to a desire for a different lens: “[It] would be great to include some assets that show the positive side of things, in addition to deficit data.”
Collectively, these results speak to a desire for greater access to data and to the core need to contextualize data to understand its true meaning. This has direct policy-making implications, particularly in cases where policy is informed by quantitative data but missing a more nuanced understanding of the root causes of issues addressed, ways they actually affect individuals’ lived experiences, and added information on data points that are not broadly collected and available.


